Mobile CSP Students Perform Well on 2018 AP CSP Exam
Congratulations Mobile CSP teachers and students!
The official results are in and Mobile CSP students performed very well on the 2018 AP CSP exam. Out of 73,732 students who took the 2018 exam, 4,031 (5.4%) were part of a course using the Mobile CSP syllabus and 76.2% of Mobile CSP students passed with a grade of 3, 4, or 5, compared to 68.9% for all students. In the following chart Mobile CSP students are shown in blue and are compared to the performance of all students. 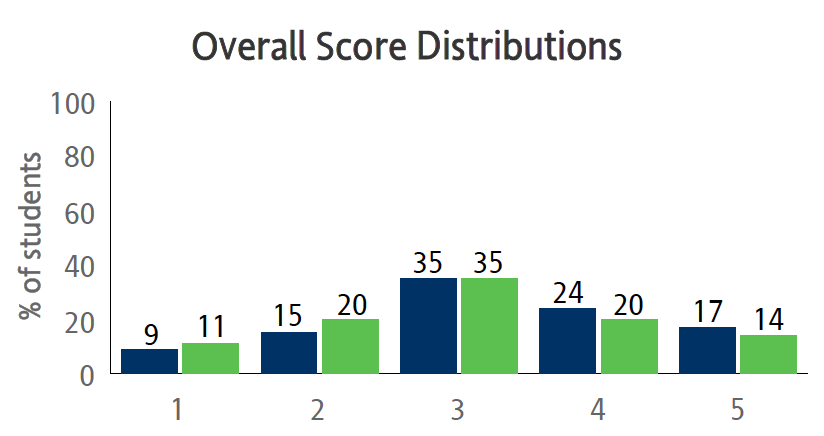
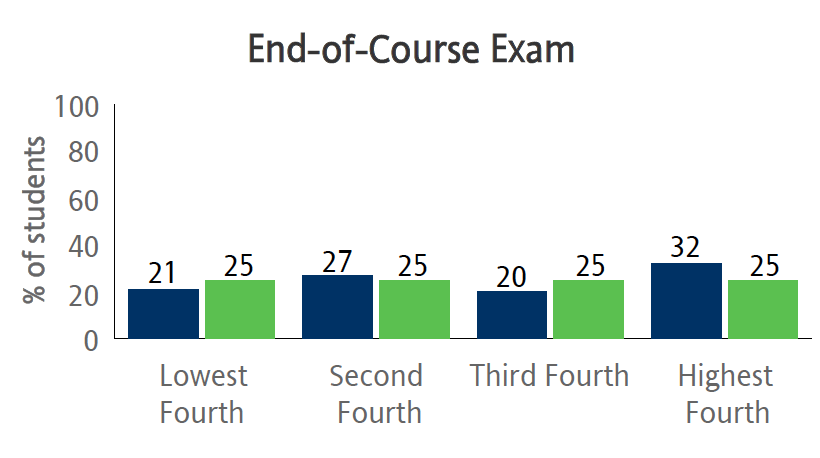
For the multiple choice part of the exam, the College Board divides all students evenly into quartiles and then calculates the percentage of our students who fall into each quartile. As this chart shows, 32% of Mobile CSP students scored in the top quartile, while only 21% or our students scored in the bottom quartile. These are good results.
On the performance task portions of the exam, Mobile CSP students did even better, with 33% of our students scoring in the top quartile and only 17% in the bottom quartile. 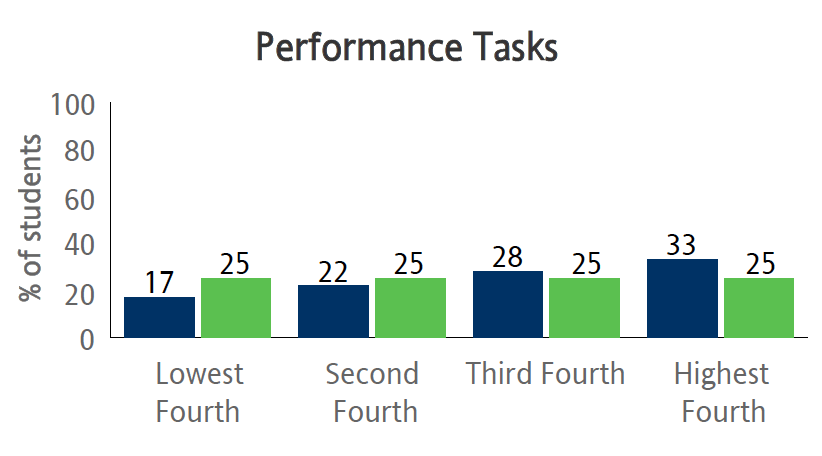
Performance by Content Area
The College Board report (link below) provides a breakdown of student performance by content area (e.g., Algorithms, Abstraction, Programming, etc.). In every one of the 15 content areas reported for the multiple choice exam and the 5 areas reported for the performance tasks, Mobile CSP students performed at or higher than the global average. For example, in the area of Abstraction 1,475 (36.6%) Mobile CSP students scored in the top quartile compared to all students. And in the Create Task Apply Algorithms area 1,609 (39.9%) scored in the top quartile. These are very strong results.
Performance by Demographic Group
The College Board has not yet given us a demographic breakdown of the Mobile CSP cohort. We will update this summary when we receive those data.
For more details, here’s a link to the original report from the College Board.
Congratulations to all our students and teachers!
78% of Mobile CSP Students Passed AP Exam
Congratulations Mobile CSP teachers and students!
The official results are in and Mobile CSP students performed very well on the AP CSP exam. Out of 47,216 students who took the 2017 exam, 3,611 (7.6%) were part of a course using the Mobile CSP syllabus and 78% passed with a grade of 3, 4, or 5, compared to 74% nationally. In the following chart Mobile CSP students are shown in blue and are compared to the performance of all students. 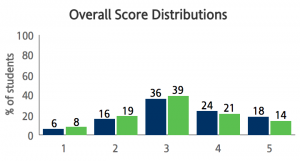
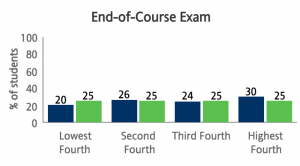
For the multiple choice part of the exam, the College Board divides all students evenly into quartiles and then calculates the percentage of our students who fall into each quartile. As this chart shows, 30% of Mobile CSP students scored in the top quartile, while only 20% or our students scored in the bottom quartile. These are good results.
On the performance task portions of the exam, Mobile CSP students did even better, with 40% of our students scoring in the top quartile. 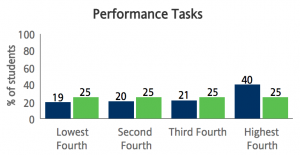
Performance by Content Area
The College Board report (link below) provides a breakdown of student performance by content area (e.g., Algorithms, Abstraction, Programming, etc.). In every one of the 15 content areas reported for the multiple choice exam and the 5 areas reported for the performance tasks, Mobile CSP students performed at or higher than the global average. For example, in the area of Abstraction 1,780 (49%) Mobile CSP students scored in the top quartile compared to all students. And in the Create Task Apply Algorithms area 1,671 (46%) scored in the top quartile. These are very strong results.
Performance by Demographic Group
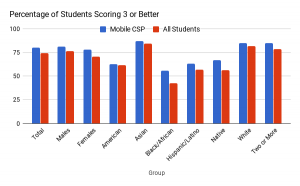
In an earlier report the College Board gave us a demographic breakdown of the Mobile CSP students who took the exam. This was for a somewhat smaller sample size (3,531 examinees). What these results show is that Mobile CSP students out-performed the average in every demographic group.
Gender and Demographic Breakdown
In terms of gender breakdown, Mobile CSP students track pretty closely to the national group, with 29% female students (compared to 30% nationally).
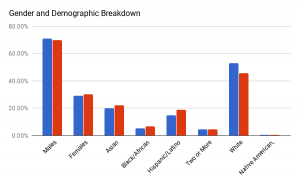
Demographically, we come in a little lower in terms of our percentages of underrepresented minorities (Black/African American and Hispanic/Latino).
For more details, here’s a link to the original report from the College Board.
Congratulations to all our students and teachers!
AP CSP Score Distributions
The College Board reported recently that
The launch of AP Computer Science Principles was the largest course launch in AP’s 60-year history. Over 2,700 schools offered the course and over 45,000 students took the AP CSP end-of-course exam in May 2017.
They also released their score distributions for CS A and CS P exams. For the CS Principles exam, the pass rate was 74.6%.
| Computer Science A | 24.4% | 20.9% | 21.9% | 11.5% | 21.3% |
| Computer Science Principles | 14% | 21.6% | 39% | 18.5% | 6.9% |
We don’t have statistics yet for Mobile CSP teachers.